Taxonomy Assignment: Different Approaches
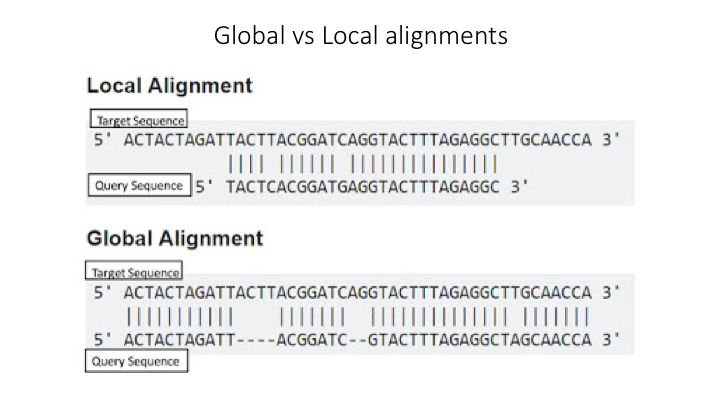
There are three basic approaches to taxonomy classification (and endless variations of each of these): Global alignment, local alignment, and Naive Bayes, or machine learning approaches in general.
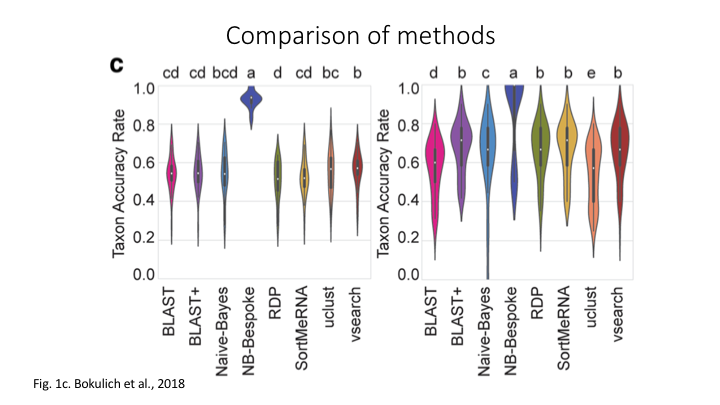
for a discussion of them see the paper.
Aligment-Based Methods
Earlier we saw results from a BLAST search of the sequences. This tool is one of the most common methods of searching DNA sequences. BLAST is an acronym for Basic Local Alignment Search Tool. It is called this because it looks for any short, matching sequence, or local alignments, with the reference. This is contrasted with a global alignment, which tries to find the best match across the entirety of the sequence.
Though BLAST is widely used, it is not necessarily the best way to search for matching sequences in metabarcoding studies.
Using Machine Learning to Assign Taxonomy
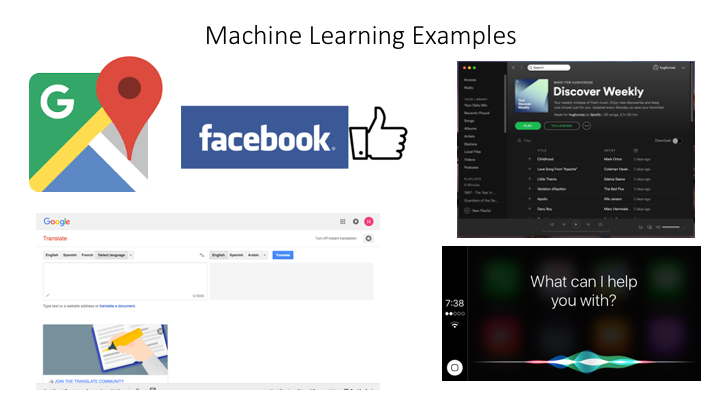
Another way to assign taxonomy utilises machine learning algorithms.
Use Naive Bayes (machine learning) to classify in Qiime
In order to use the Naive Bayes (NB) method to assign taxonomy, it is necessary to train the sequence database first. Because this can take a great deal of time, a pre-trained classifier has been made available for you. The details of how this classifier was ‘trained’ appear on the database preparation page](preparing_database.md). The Qiime2 Data Resources page provides some pre-trained classifiers for common primer combinations, as well as links to the Greengenes and Silva databases for 16S and 18S gene studies. For additional primer combinations, or other gene references, there is a tutorial for training feature classifiers.
Because this command can take a few minutes to run, we will run it as a slurm job. Copy the example script to your own directory. The example job script is in the scripts folder.
cd ../scripts
sbatch naive_bayes_classify_fish.sh
Open up your copy and we will go over the commands
The output of this script will produce a file called fish_OTUs_NB_taxonomy.qza. We will now create a visualisation of the classification of each OTU:
qiime metadata tabulate \
  --m-input-file fish_OTUs_NB_taxonomy.qza \
  --o-visualization fish_NB_taxonomy_VIZ.qzv
As with the previous visualisation, open up the Qiime2View webpage and paste in the following link:
https://otagoedna.github.io/2019_11_28_edna_course/example_viz/fish_NB_taxonomy_VIZ.qzv
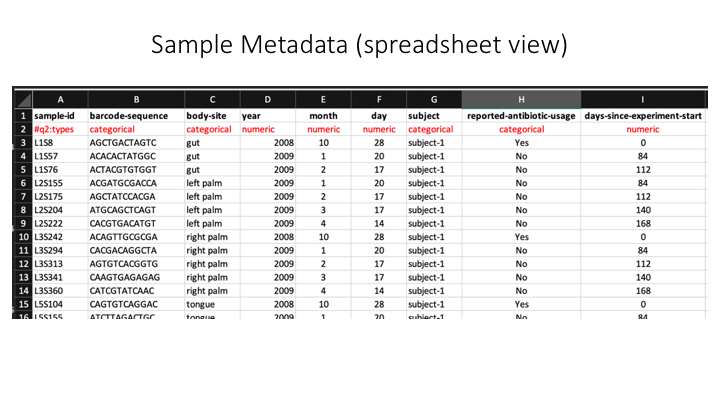
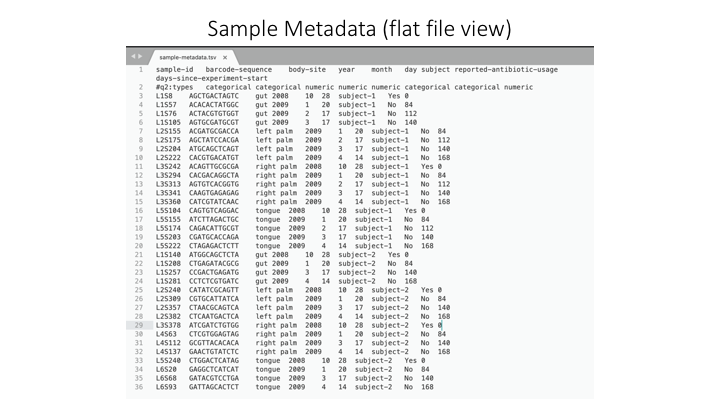
A barplot graph is a good way to compare the taxonomic profile among samples. For this we also need a text file that has sample metadata. For this exercise, one is provided, but for your own projects, they can be as simple or complex as needed. They do not even need to have fields (but this will limit downstream analysis). You can prepare it in Microsoft Excel, but then you need to export it as a tab-delimited text file (e.g. .tsv)
Here is an example metadata file in Excel:
And here is the same example, but in a plain (tab-delimited) text file:
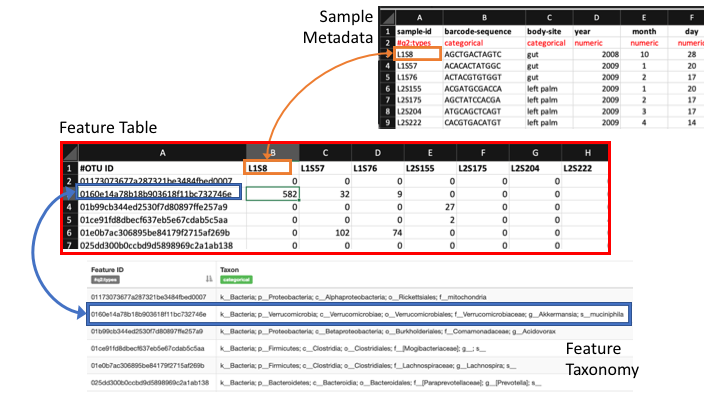
With the sample metadata, you can now create a bar plot of your taxonomy assignments. Qiime combines the information from all these sources in the visual:
Run the command:
qiime taxa barplot \
  --i-table fish_frequency_table.qza \
  --i-taxonomy fish_OTUs_NB_taxonomy.qza \
  --m-metadata-file ../meta/sample_metadata.txt \
  --o-visualization fish_NB_taxonomy_barplot.qzv
To view, paste the following link into the Qiime2View webpage:
https://otagoedna.github.io/2019_11_28_edna_course/example_viz/fish_NB_taxonomy_barplot.qzv
Exporting Qiime files
For some downstream analyses, it is necessary to convert our qiime-formatted files into flat (plain text) files so they can be used in other programs. Most Qiime files can be converted with the simple qiime tools export command. We will convert the taxonomy of classification that we just made:
The export command needs to be first exported to a folder, so we will make one:
mkdir exports
Now, use qiime to export
qiime tools export \
  --input-path fish_OTUs_NB_taxonomy.qza \
  --output-path exports
This creates a file called taxonomy.tsv. We will rename that so there is no confusion:
mv exports/taxonomy.tsv fish_OTUs_NB_taxonomy.tsv
Try Taxonomy Assignment with VSEARCH (global alignment method)
We will now try a global alignment method to assign taxonomy. As with the machine learning classification, we will run this through a job script.
sbatch vsearch_classify_fish.sh
We have found that the default in Qiime2 for this approach can produce some unwanted results. Open the file in a text editor and we will go over how we have adjusted this.
The output of this script is: fish_OTUs_vsearch_taxonomy.qza
As with the Naive Bayes (machine learning) method, you can create visuals to view the results. There is an example of the vsearch result on the following link, which you can open in Qiime2View.
https://otagoedna.github.io/2019_11_28_edna_course/example_viz/fish_OTUs_vsearch_taxonomy_VIZ.qzv
We will now compare the differences in the two taxonomic assignments. (Better to have two Qiime2View windows opened for this.)
Here is a link to the vsearch bar plots file:
https://otagoedna.github.io/2019_11_28_edna_course/example_viz/fish_OTUs_vsearch_taxonomy_barplot.qzv
Collapse frequency table by taxonomy assignment
When we made the barplots, Qiime2 combines the information from the frequency and taxonomy tables (and sample metadata). For some downstream applications, you might want to collapse the OTU frequencies around their taxonomy assignments. We have a handy script that will do that. All you need is the original frequency table and the flat file version of the taxonomy assignments (exported from Qiime above).
../scripts/collapse_by_taxonomy.py \
  -f ../out/zotutab.txt \
  -t fish_OTUs_NB_taxonomy.tsv
The outputs from this script are taxonomy and frequency tables for which the OTUs have been collapsed around the taxon to which it was assigned.